

P. E. An, S.M. Smith, L.K. Shay, H. Peters, J.C. Van Leer, A.J. Mariano
DATA!!!
Goal
Objectives
Work Plan
Mixed Layer Experiment
Tidal Experiment
Bottom Boundary Layer Experiment
Online Data
We see the combination of strong S winds with the Gulf Stream on the shelf from July 1 to July 4. (Note the color scale change on July 4th).Click on the maps below to enlarge them.
| July 1-4 1999 | ||

July 1 3:20 GMT |
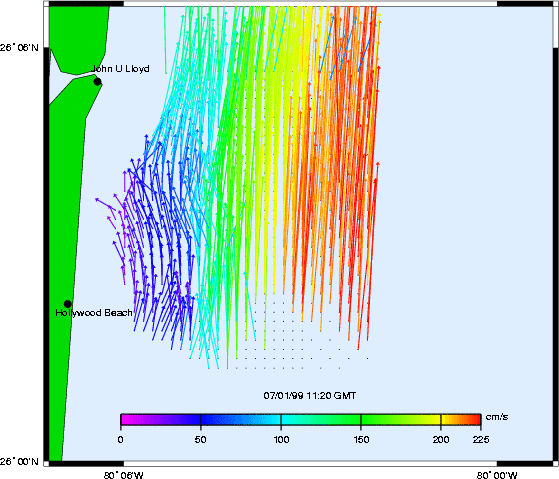
July 1 11:20 GMT |
|
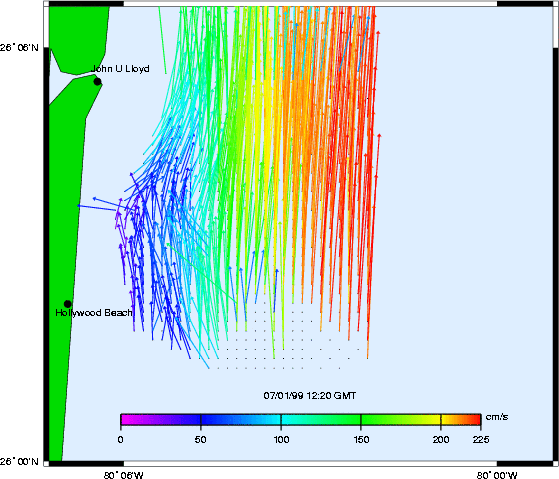
July 1 12:20 GMT |

July 2 3:20 |
|

July 2 14:00 GMT |

July 2 17:40 GMT |
|

July 3 0:00 GMT |

July 3 1:00 GMT |
|

July 3 6:40 GMT |
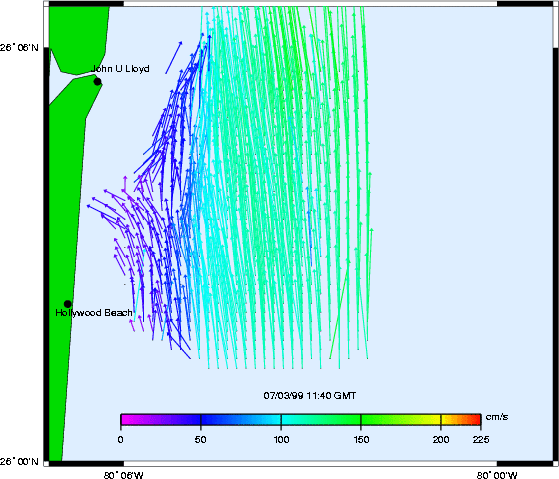
July 3 11:40 GMT |
|
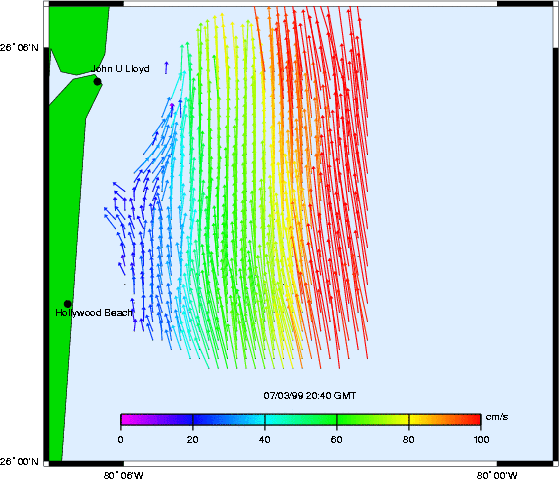
July 3 20:40 GMT (note scale change) |

July 4 0:20 GMT |
|
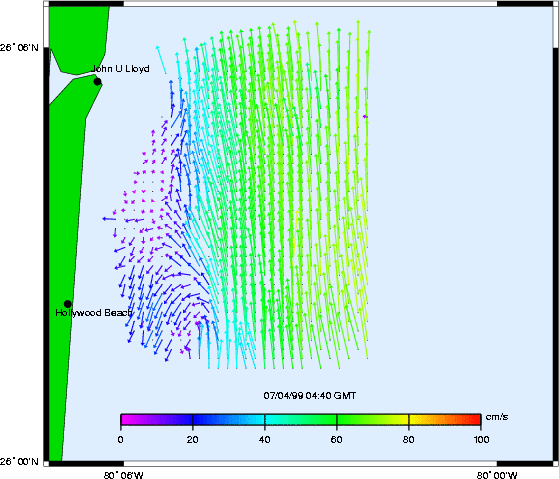
July 4 4:40 GMT |
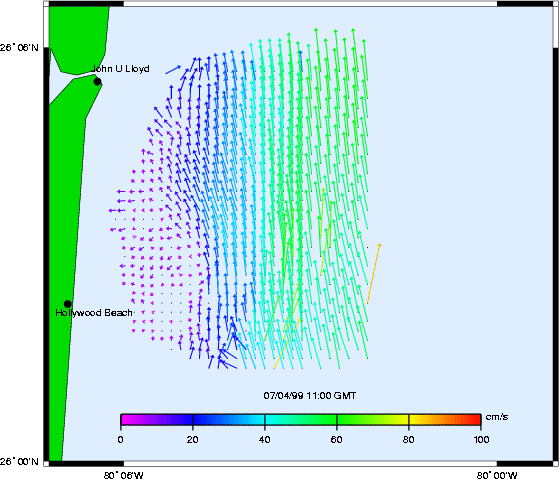
July 4 11:00 GMT |
|